Tutorial - How to use LINEX
Tutorial for LINEX version 1
1. Upload
In order to use LINEX version 1 a Lipid data file needs to be uploaded
in .csv format (Comma separated values) or .tsv format (Tab separated values).
To do so go to the upload page and select version 1.
Additionally, a file containing Sample Groups, Lipid Class Settings or Fatty Acid Settings can be uploaded.
Structure of the files:
- Lipid data file (required, .csv or .tsv):
The actual lipidomics measurement. Contains a set of samples for which lipids are quantified. This can be concentrations or intensities. - Sample groups (optional, .csv or .tsv):
The sample groups file assigns samples to groups. This can be experimental conditions such as case & control or patient disease status. These will be used to calculate statistics over samples belonging to one group/condition. Please make sure sample names are identical to the lipid data file. - Lipid class settings (optional, .txt):
When a Lipid class settings file is uploaded class connections can be customised and additional lipid classes can be set.
Lipid classes with a different number of fatty acids should only be connected if they have the same head group (e.g. (PC-LPC, DG-TG), because there are no internal checks.
Please make sure to use only LipidLynxX abbreviations as Lipid classes. The only exception Cholesterol-esters which needs to be referred to as CE instead of ST.
An enzyme can be added to a reaction with a |. (e.g. LPI: PI|MBOAT7 would assign MBOAT7 to catalyse the reaction from a LPI to a PI). Because of this directed enzyme annotation, lipid class connections are treated as un-symmetric. However, the direction is only considered for enzyme annotation and if a directed graph is drawn (see Section 1.2 for details).
The default lipid class settings can be found here. - Fatty acid settings (optional, .txt):
When a Lipid class settings file is uploaded fatty acids can be defined and specific reactions can be defined and excluded.
Defining fatty acids means only the specified fatty acids can be incorporated into a lipid reaction. This is to avoid naturally unrealistic reactions. Fatty acid annotation has to be in the form: C:DB;OH, where hydroxy groups are optional (default 0) Possible fatty acids can either be defined for all lipid classes or lipid class specific, by adding the lipid class abbreviation(s) (comma separated) after the 'Classes:' keyword (see below).
Reaction rules are simply set by specifying the changes in chain length, double bonds and hydroxy groups. E.g 'Elongation: C:2, DB:0, OH:0' defines reactions such as 18:0;0 → 20:0;0 and labels them as 'Elongation'. Using the 'Excluded Reactions' keyword, specific reactions between a pair of fatty acids, allowed by the general reaction rules set via 'Reactions', can be excluded. The syntax is simply 'FA1, FA2'.
The default fatty acid settings can be found here.
The uploaded files should follow the scheme shown in Section 1.1. An example lipidomics dataset can be used for testing and exploring.
1.1. File formats
| Lipid1 | Lipid2 | ... | |
|---|---|---|---|
| Sample1 | 1.2 | 2.3 | ... |
| Sample2 | 3.4 | 4.5 | ... |
| ... | ... | ... | ... |
| SampleGroup | |
|---|---|
| Sample1 | name1 |
| Sample2 | name2 |
| ... | ... |
| >Class Connections |
|---|
| PC: PE, DG, ... |
| PE: PC, DG, ... |
| ... |
| Class FA Numbers |
| DG: 2 |
| TG: 3 |
| ... |
| Fatty Acids |
|---|
| Classes: |
| 18:0 |
| 18:1 |
| ... |
| Classes: SM, Cer, ... |
| 18:1;1 |
| ... |
| Excluded Reactions |
| 20:3, 20:4 |
| ... |
| Reactions |
| Elongation: C: 2, DB: 0, OH: 0 |
| ... |
1.2. Computation Options
The default options can be used as a standard. To optimize runtime make sure only the required checkboxes are selected.
- Check if the input data is log-transformed. This is important for correct fold-change calculations.
- Check if the computed fold-changes should be log transformed. It has no effect if the data is already log-transformed (see above)
- It should only be checked if lipid species names are not yet in the LipidLynxX nomenclature. Be aware that converting names may take up to several minutes. Re-conversion of already converted species increases runtime and might throw errors for molecular species.
- If you need to convert, please make sure you are following one of the supported notations (see lynx github at 'Supported lipid notation styles')
- To avoid the conversion process multiple times for the same file you can download the converted data ('LipidLynxX Converted Data as .csv') once the network computation has finished. A list of lipid species with incorrect notations will also be available ('Unconverted Lipid Species') on the download page.
Lipid Resolution
- Setting the highest resolution to consider, this means all lipids with a lower resolution are considered as they are.
If you set the highest resolution to 'Molecular Species', for example, sum species will be kept as such, but sn-specific annotations will only be considered as non sn-specific.
Please only change this parameter if all lipids are sum species or some are confident sn-specific identifications.
Ordered in decreasing resolution: Sn-specific > Molecular Species > Sum species.
-
Check if Correlations/Correlation Changes should be computed. Missing values just skipped.
See node colouring options (Section 3) for a short explanation for how correlation changes are computed and what they mean.
Unsignificant correlations (FDR > .05) are automatically set to 0.
-
Check if Partial-Correlations/-Correlation Changes should be computed. Only possible when there are no missing values.
Partial correlations only consider 'direct' correlation, i.e. without the effect of all other lipids, in contrast to 'regular' correlations which also show indirect relations.
See node colouring options (Section 3) for a short explanation for how partial correlation changes are computed and what they mean.
Unsignificant partial correlations (FDR > .05) are automatically set to 0 if p-values (from Fisher's z-transform) could be computed. If the sample to feature ratio is too small p-values cannot be computed and you will be notified by a warning. In this case all partial correlation values are displayed as they are.
-
Check if (log) Fold Changes should be computed. Fold changes are computed as groupA/groupB or groupA - groupB respectively.
Positive values indicate higher values in the group named at first position!.
Reference Group
-
If you uploaded Sample groups and no Reference Group is chosen all pairwise combinations between sample groups will be calculated.
If there are Sample groups uploaded and a Reference Group is given fold-changes, p-values and (partial) correlation changes are computed against the Reference Group.
If did not upload Sample groups this will have no effect.
Please ensure correct spelling (heading and trailing whitespaces are ignored).
-
Check if p-values (binary statistical tests) should be computed.
All p-values are automatically FDR correct using the Benjamini-Hochberg procedure.
If the data is approximately normally distributed t-test should be used to get more powerful results. Otherwise we recommend using rank-based tests (Wilcoxon rank-sum and Mann-Whitney U rank test). In the case of paired data, we recommend using Wilcoxon's signed rank test.
-
Check if the displayed network should be directed.
This has no effect on statistical measures, but will lead to reaction and enzyme annotation being assigned to a defined reaction direction.
The directed graph option will consume a considerably higher amount of memory and cpu!
1.3. Upload & compute network
Check if everything is set correctly and press the button. The computation will start.
The uploaded data can only be used once. If you want to change a Computation option or open a new tab make sure the input data is still selected otherwise it has to be re-uploaded.
Deleting your browser cookies while using LINEX will also lead to a loss of results, because your data is matched by an anonymous session id.
NOTE: if you upload a new dataset all prior results will be lost!
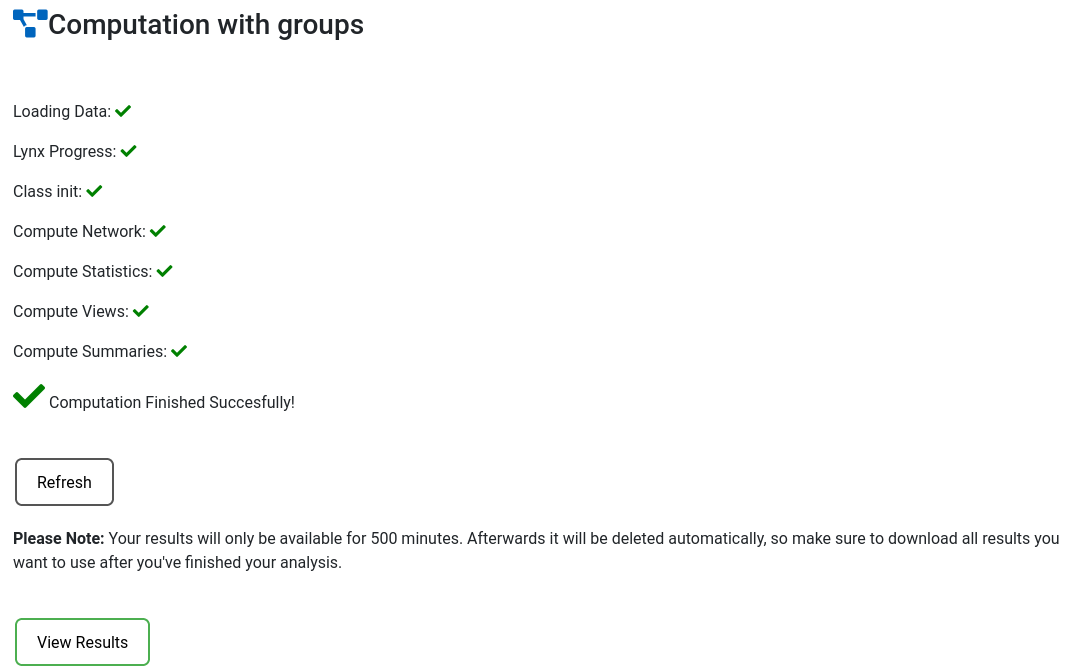
When the computation is done a 'View results' button will appear taking you to the analysis page.
2. Analysis
2.1. Network Visualisation Parameters
- Node Colours
- Edge Colours
- Node size
- Comparison: defines which comparison (e.g. groupA vs. groupB) will be used for FDR-values, fold-changes and (partial) correlation changes.
- Group: defines which group (e.g. groupA) will be used to display (partial) correlation values.
- Find Lipid Species
- Find Lipid species by its name
- Find by Substring
- Find lipid species by substrings. Supports Regular Expression (see examples below).
- PC: will find all lipid species with "PC" in their name (e.g. LPC, PC, PCO etc.)
- ^PC will find all lipid species whose name is starting with "PC"
- ^PC|^PE will find all lipid species whose name is starting with "PC" or "PE"
- ^PC.*16:0 will find all lipid species whose name is starting with "PC" and contains a 16:0
- Shown reaction types: Select, if all reactions, only lipid class reactions or only fatty acid reactions should be shown.
- Enable physics: If enabled, the network layout is computed dynamically. This means, that moving one lipid with the cursor will move the whole netowrk dynamically.
2.2. Legend
- Node colours (only)
- Lipid Classes
- Lipid class colours are pre-defined (see . For a description on how the colour map was generated refer to the LINEX publication.
- If you add custom lipid classes not covered by our colour scheme, it will default to a dark grey.
- It is currently not possible to choose specific lipid class colour maps
- Edge colours
- Lipid Reactions: kind of reaction an edge is representing
- Chain length: change of the number of C atoms
- Desaturation: change of the number of double bonds
- FA addition: connection of two lipids with the same head group but different numbers of fatty acids
- Head Group Modification: head group related reaction between two lipid species with the same fatty acids/sum composition
- Attention: when customising fatty acid reactions in which more than one FA property is changed at ones colour annotation will not be accurate anymore
- Correlations: correlation between the connected lipids
Shown correlations are statistically significant - Correlation Changes: discrete categories of changes in correlation between two sample groups.
'significant' and 'unsignificant' refer to statistical significance - negative to positive: significant correlation in both groups, <0 in groupA and >0 groupB
- positive to negative: significant correlation in both groups, >0 in groupA and <0 groupB
- significant to unsignificant: significant correlation in groupA, unsignificant in groupB
- unchanged significant: significant in both groups, either both >0 or both <0
- unsignificant: unsignificant correlation, i.e. uncorrelated, in both groups
- unsignificant to significant: unsignificant in groupA, signicant in groupB
- Partial Correlations: partial correlation between the connected lipids
- Partial Correlation Changes: discrete groups of changes analogous to 'Correlation Changes'
- Node size or colour
- -log10(FDR)
- Fold Changes
- Fold changes are computed a groupA/groupB (or groupA - groupB if log-transformed/log-ratios)
- If the selected comparison is groupA_groupB positive (log) fold-changes indicate higher values in groupA!
- Desaturation
- Degree (number of edges per node)
- C Index
- Chain Length
- Betweenness Centrality
- The Betweenness Centrality quantifies the importance of a node. It indicates how many shortest paths between any couple of nodes in the graphs pass through a node.
- Closeness Centrality
- The Closeness Centrality indicates the accessibility of a node. It is a measure of the average shortest distance from a node to all other nodes.
- DB Index
2.3. Additional Features
By clicking on nodes or edges in the colour legend all unselected edge/node types will turn grey in the network. Multiple selection by holding ctrl while selecting is possible. To restore all colours simply click on a non-populated spot inside the colour legend area.
The size legend will be scaled according to the network zoom (i.e. re-scaled every time the network is zoomed in or out). For better readibility it is also possible to zoom the size legend individually.
Zooming via mouse scroll and moving nodes with the cursor is supported for both the network and legend elements.
Additional information can be viewed by hovering over edges and nodes.
The current network view can also be downloaded as a pdf file.
3. Download
Choose the desired files to download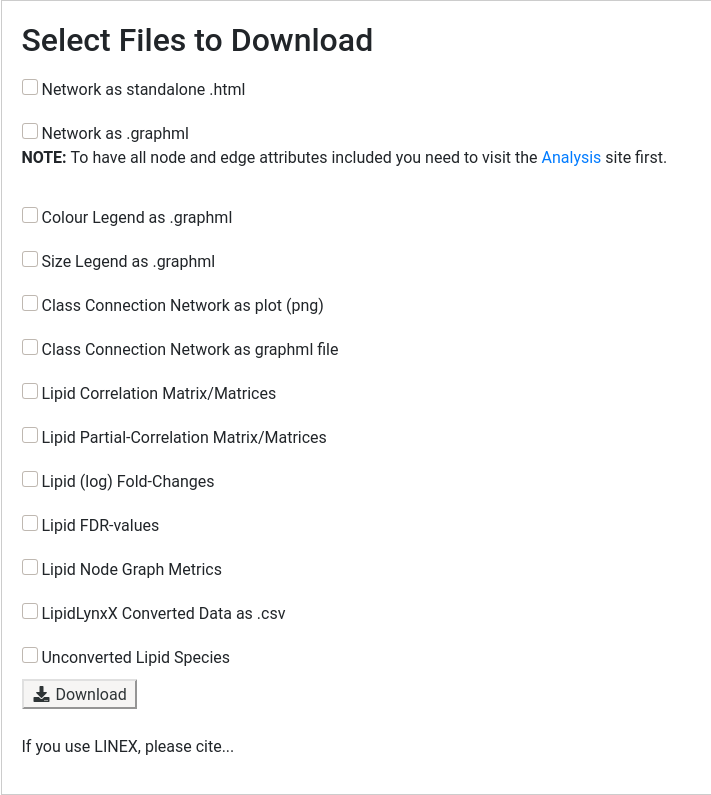
3.1 Network related files
The network can be downloaded as .html file or as .graphml.
The standalone html file can be opened in a browser (locally) and resembles the analysis page with all interactive functions.
Graphml is a general graph storage format. It can be used to import the network into graph tools like Cytoscape in order to generate publication ready plots.
By downloading colour and size legend data the same tools can also be used to create the corresponding legends in a suitable format.
To show the lipid class connections used in your session you can download the corresponding graph as a png image or as a graphml file.
3.2 LipidLynxX related files
LipidLynxX Converted Data along with a list of incorrectly annotated species names can only be downloaded if the conversion options was checked on the upload page.
3.3 Statistical Metrics
All computed statistics (as defined on the upload page) can be downloaded as csv files. If sample groups were given one file for each group (or comparison) will be provided.
For (partial) correlations the full correlation matrix is returned, thus also including values for lipid pairs with no (direct) connection in the network.
3.4 Download pdf-view from JSON
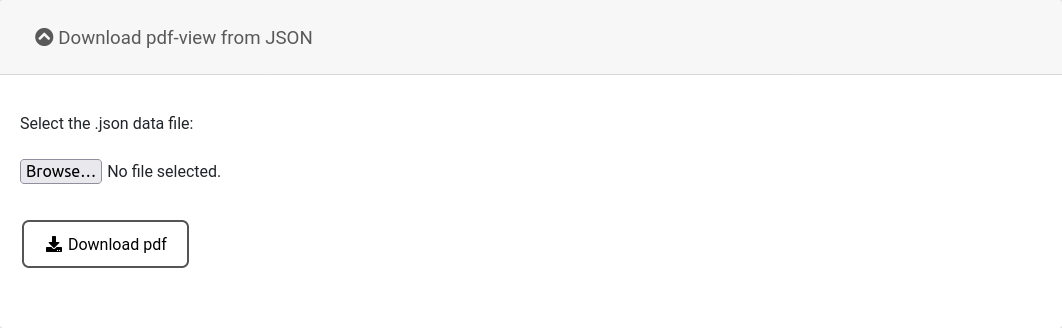
After downloading the standalone html file, the network can be interactively used locally. If high-quality pdf figures of network views should be generated, a JSON file can be generated from the standalone pdf file. These files can be uploaded here and will be converted into a pdf that can be used e.g. in publications.
4. Delete Data
Data is saved on the server for 500 minutes after upload and will automatically be deleted afterwards, but it can be deleted manually here as well.
Tutorial for LINEX2
Before working with LINEX2, please read the publication to understand the method and application cases of the software. The links can be found on the About page. This tutorial will walk you through all the steps to analyze lipidomics data with LINEX2.
Lipid nomenclature
LINEX2 supports the nomenclature used in the Swiss Lipids and LIPID MAPS databases. Examples are: PC(48:4), PS(18:1_20:0), SM(d18:0/18:0), SM(36:1;O2), ... . If your lipidomics data is not compatible with this nomenclature it is possible to convert the nomenclature in LINEX2 using LipidLynxX.
LINEX2 has support for over 100 lipid classes. The latest version of a supported lipid classes is available here. If a lipid class is not available, please contact the developers ( About ).
1. Upload
In order to use LINEX2 a Lipid data file needs to be uploaded
in .csv format (Comma separated values) or .tsv format (Tab separated values).
To do so go to the upload page and select version 2.
Additionally, a file containing Sample Groups, Lipid Class Settings or Fatty Acid Settings can be uploaded.
An example for each file can be downloaded here .
The requirements for each file are as follows:
- Lipid data file (required, .csv or .tsv):
The actual lipidomics measurement. Contains a set of samples for which lipids are quantified. This can be concentrations or intensities. Labels for samples are required (See schematic in Section 1.1.). - Sample groups (required, .csv or .tsv):
The sample groups file assigns samples to groups. This can be experimental conditions such as case & control or patient disease status. These will be used to calculate statistics over samples belonging to one group/condition. This csv or tsv file contains two columns, the first column with the sample names (identical to the sample names in the lipid data file), and the experimental group, a sample belongs to (See schematic in Section 1.1.). Please make sure sample names are identical to the lipid data file. - Fatty acid settings (optional, .txt):
To calculate lipid metabolic networks, LINEX2 internally requires molecular species of each lipid. However, lipids are often only identified as sum species (e.g. sum species: PC(34:1) vs. molecular species PC(16:0_18:1)). In the fatty acid settings file, users can define (class-specific) fatty acids, of which sum species can be composed. These are then used to generate potential molecular species of each sum species in the network generating algorithm. More provided fatty acids can make lipid networks of sum species lipids more comprehensive, but increase the runtime. The file (see schematic in Section 1.1) requires fatty acid definitions after the "> Fatty Acids" tag. This is followed by The line "Classes:". After this fatty acids are listed that can be used for all lipid classes to infer molecular species from sum species. It is also possible so specify Fatty acids that are only used for specific lipid classes. For example fatty acids for the classes SM and Cer can be listed after the line "Classes: SM, Cer". Only the fatty acids listed below this line are used to infer molecular species for these classes.
Another important aspect of the file are fatty acid reactions. LINEX2 has the ability to show potential fatty acids reactions such as elongation or desaturation. These are rule based and defined in the ">Reactions" section of the file. A fatty acid elongation, in which two carbon atoms are added to the aliphatic chain can be defined like this: 'Elongation: C:2, DB:0, OH:0'. 'Elongation' is a user defined label for the reaction, "C:2" describes an increase of two carbon atoms. Likewise, desaturations can be defined "C:0. CB:1, OH:0" or hydroxylations "C:0. CB:0, OH:1". Per default, these fatty acid reactions are not used for long chain bases. If they should also be applied for them, add ", lcb" at the end on the reaction definition. Using the '>Excluded Reactions' keyword, specific reactions between a pair of fatty acids, allowed by the general reaction rules set via 'Reactions', can be excluded. This might be, since some fatty acid conversions are not possible in some organisms. The syntax is simply 'Fatty acid 1, Fatty acid 2'. Please have a look at the default fatty acids file to understand the structure. - Confirmed lipid species (optional, .txt):
In some experiments, where lipids are quantified as sum species, molecular species are confirmed, but not quantified. As explained before, LINEX2 internally requires molecular species. If confirmed molecular species are uploaded, other potential molecular species for their sum species are not computed. This reduces computation time and makes the networks more accurate by relying on measured molecular species.
The uploaded files should follow the scheme shown in Section 1.1. An example lipidomics dataset can be used for testing and exploring.
1.1. File formats
| Lipid1 | Lipid2 | ... | |
|---|---|---|---|
| Sample1 | 1.2 | 2.3 | ... |
| Sample2 | 3.4 | 4.5 | ... |
| ... | ... | ... | ... |
| SampleGroup | |
|---|---|
| Sample1 | name1 |
| Sample2 | name2 |
| ... | ... |
| >Fatty Acids |
|---|
| Classes: |
| 18:0 |
| 18:1 |
| ... |
| Classes: SM, Cer, ... |
| 18:1;1 |
| ... |
| >Excluded Reactions |
| 20:3, 20:4 |
| ... |
| >Reactions |
| Elongation: C: 2, DB: 0, OH: 0 |
| ... |
| PC(16:0_18:1) |
|---|
| PC(18:1_18:1) |
| DG(20:0_20:4) |
| ... |
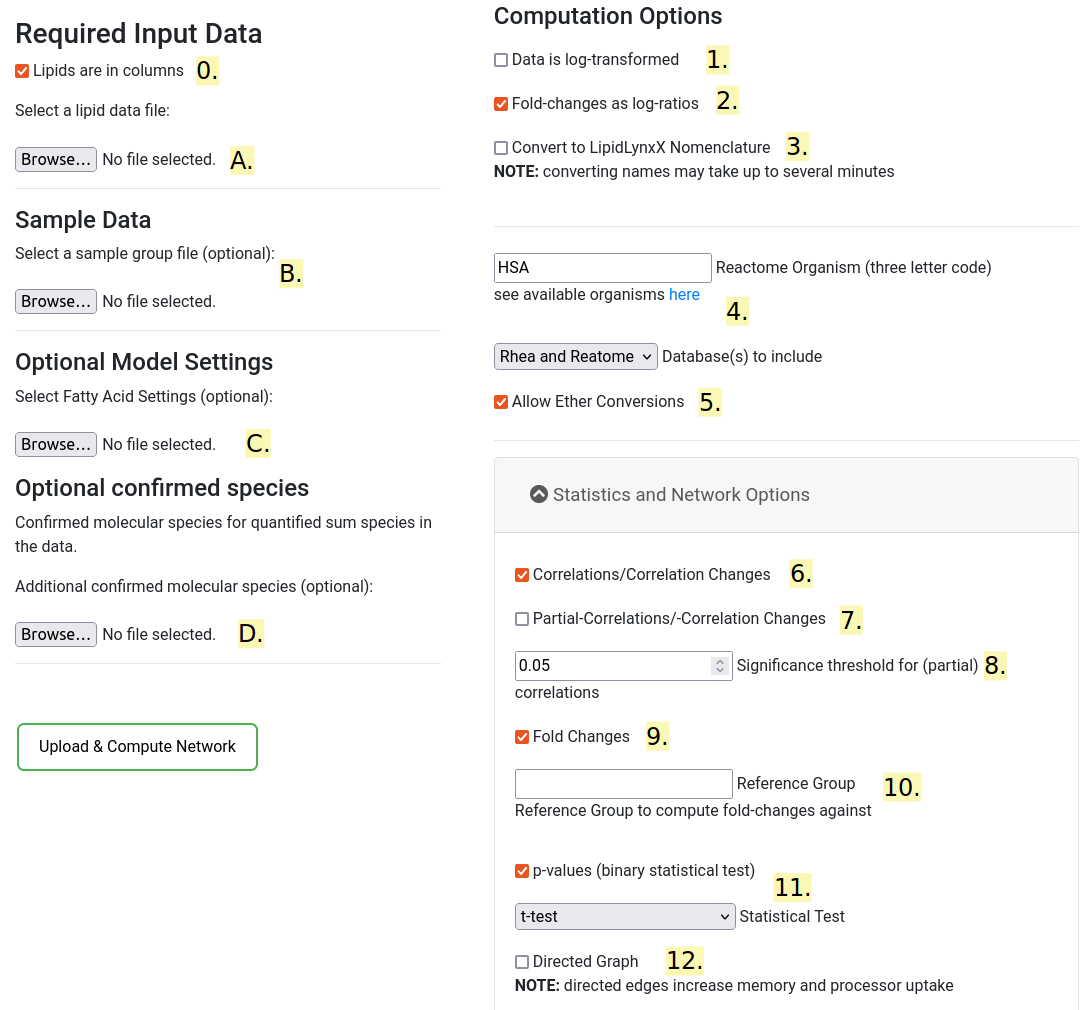
1.2. Computation Options
The default options can be used as a standard. To optimize runtime make sure only the required checkboxes are selected.
- Lipids are columns
Define if in the uploaded lipidomics data the lipids are in columns or rows. - Data is log-transformed
Check if the input data is log-transformed. This is important for correct fold-change calculations. - Fold-changes as log-ratios
Check if the computed fold-changes should be log transformed. It has no effect if the data is already log-transformed (see above). - Convert to LipidLynxX Nomenclature
It should only be checked if lipid species names are not yet in the LipidLynxX nomenclature. Be aware that converting names may take up to several minutes. Re-conversion of already converted species increases runtime and might throw errors for molecular species. If you need to convert, please make sure you are following one of the supported notations (see lynx github at 'Supported lipid notation styles') To avoid the conversion process multiple times for the same file, you can download the converted data ('LipidLynxX Converted Data as .csv') once the network computation has finished. A list of lipid species with incorrect notations will also be available ('Unconverted Lipid Species') on the download page. - Database options
LINEX2 used curated lipid-metabolic reactions from the Rhea and Reactome databases. Users can choose if both or just one of the databases should be used to compute the lipid network. If Reactome is chosen, a (supported) species has to be entered (3-letter code). The list of all supported species can be found here. - Ether conversions
LINEX2 can show connections in the network between ether and non-ether lipids (e.g. PC(18:0_18:1) → PC(O-18:0_18:1)). Not all of these potential reactions occur, but can help to visualize systematic lipidomic alterations. With this option, it can be selected if they should be shown in the network or not. - Correlations/Correlation Changes
Check if Correlations/Correlation Changes should be computed. Missing values just skipped. See node colouring options (Section 3) for a short explanation for how correlation changes are computed and what they mean. Insignificant correlations (FDR > .05) are automatically set to 0. - Partial-Correlations/-Correlation Changes
Check if Partial-Correlations/-Correlation Changes should be computed. Only possible when there are no missing values. Partial correlations only consider 'direct' correlation, i.e. without the effect of all other lipids, in contrast to 'regular' correlations which also show indirect relations. See node colouring options (Section 3) for a short explanation for how partial correlation changes are computed and what they mean. Insignificant partial correlations (FDR > .05) are automatically set to 0 if p-values (from Fisher's z-transform) could be computed. If the sample to feature ratio is too small p-values cannot be computed and you will be notified by a warning. In this case all partial correlation values are displayed as they are. - Significance threshold
Threshold for which (partial) correlations and statistical tests are shown as significant (after multiple testing corrections). - Fold Change
Check if (log) Fold Changes should be computed. Fold changes are computed as groupA/groupB or groupA - groupB respectively. Positive values indicate higher values in the group named at first position!. - Reference Group
If you uploaded Sample groups and no Reference Group is chosen all pairwise combinations between sample groups will be calculated. If there are Sample groups uploaded and a Reference Group is given fold-changes, p-values and (partial) correlation changes are computed against the Reference Group. If did not upload Sample groups this will have no effect. Please ensure correct spelling (heading and trailing whitespaces are ignored). - p-values
Check if p-values (binary statistical tests) should be computed. All p-values are automatically FDR correct using the Benjamini-Hochberg procedure. If the data is approximately normally distributed t-test should be used to get more powerful results. Otherwise, we recommend using rank-based tests (Wilcoxon rank-sum and Mann-Whitney U rank test). In the case of paired data, we recommend using Wilcoxon's signed rank test. - Directed Graph
Only usable for LINEX version 1.
1.3. Upload & compute network
Check if everything is set correctly and press the Upload & Compute Network button.
The computation will start.
If you want to change a Computation options the data has to be uploaded again.
Deleting your browser cookies while using LINEX2 will also lead to a loss of results,
because your data is matched by an anonymous session id.
NOTE: if you upload a new dataset all prior results will be lost!
When the computation is done a 'View results' button will appear taking you to the analysis page.
2. Analysis
The Analysis page consists of three views, which can be accessed at the top (See image below). The Network (A), Network Enrichment (B) and Lipidome summary (C). All views offer different analysis and visualization options.
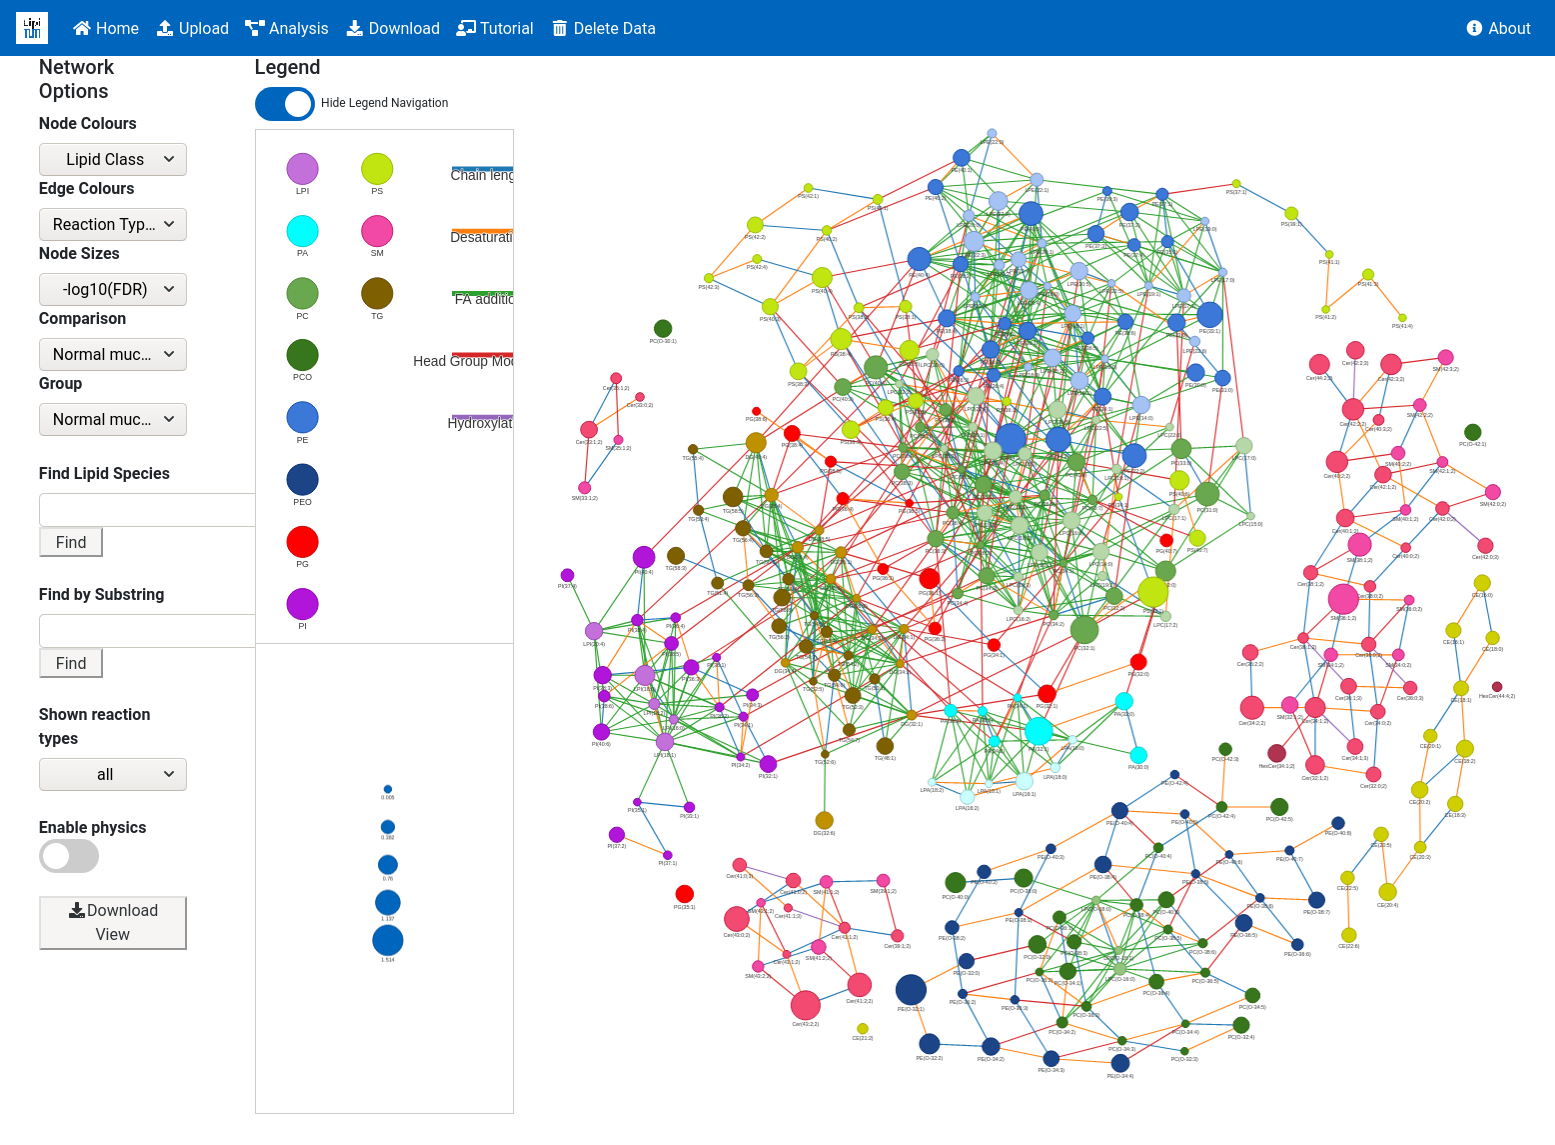
A. Network view
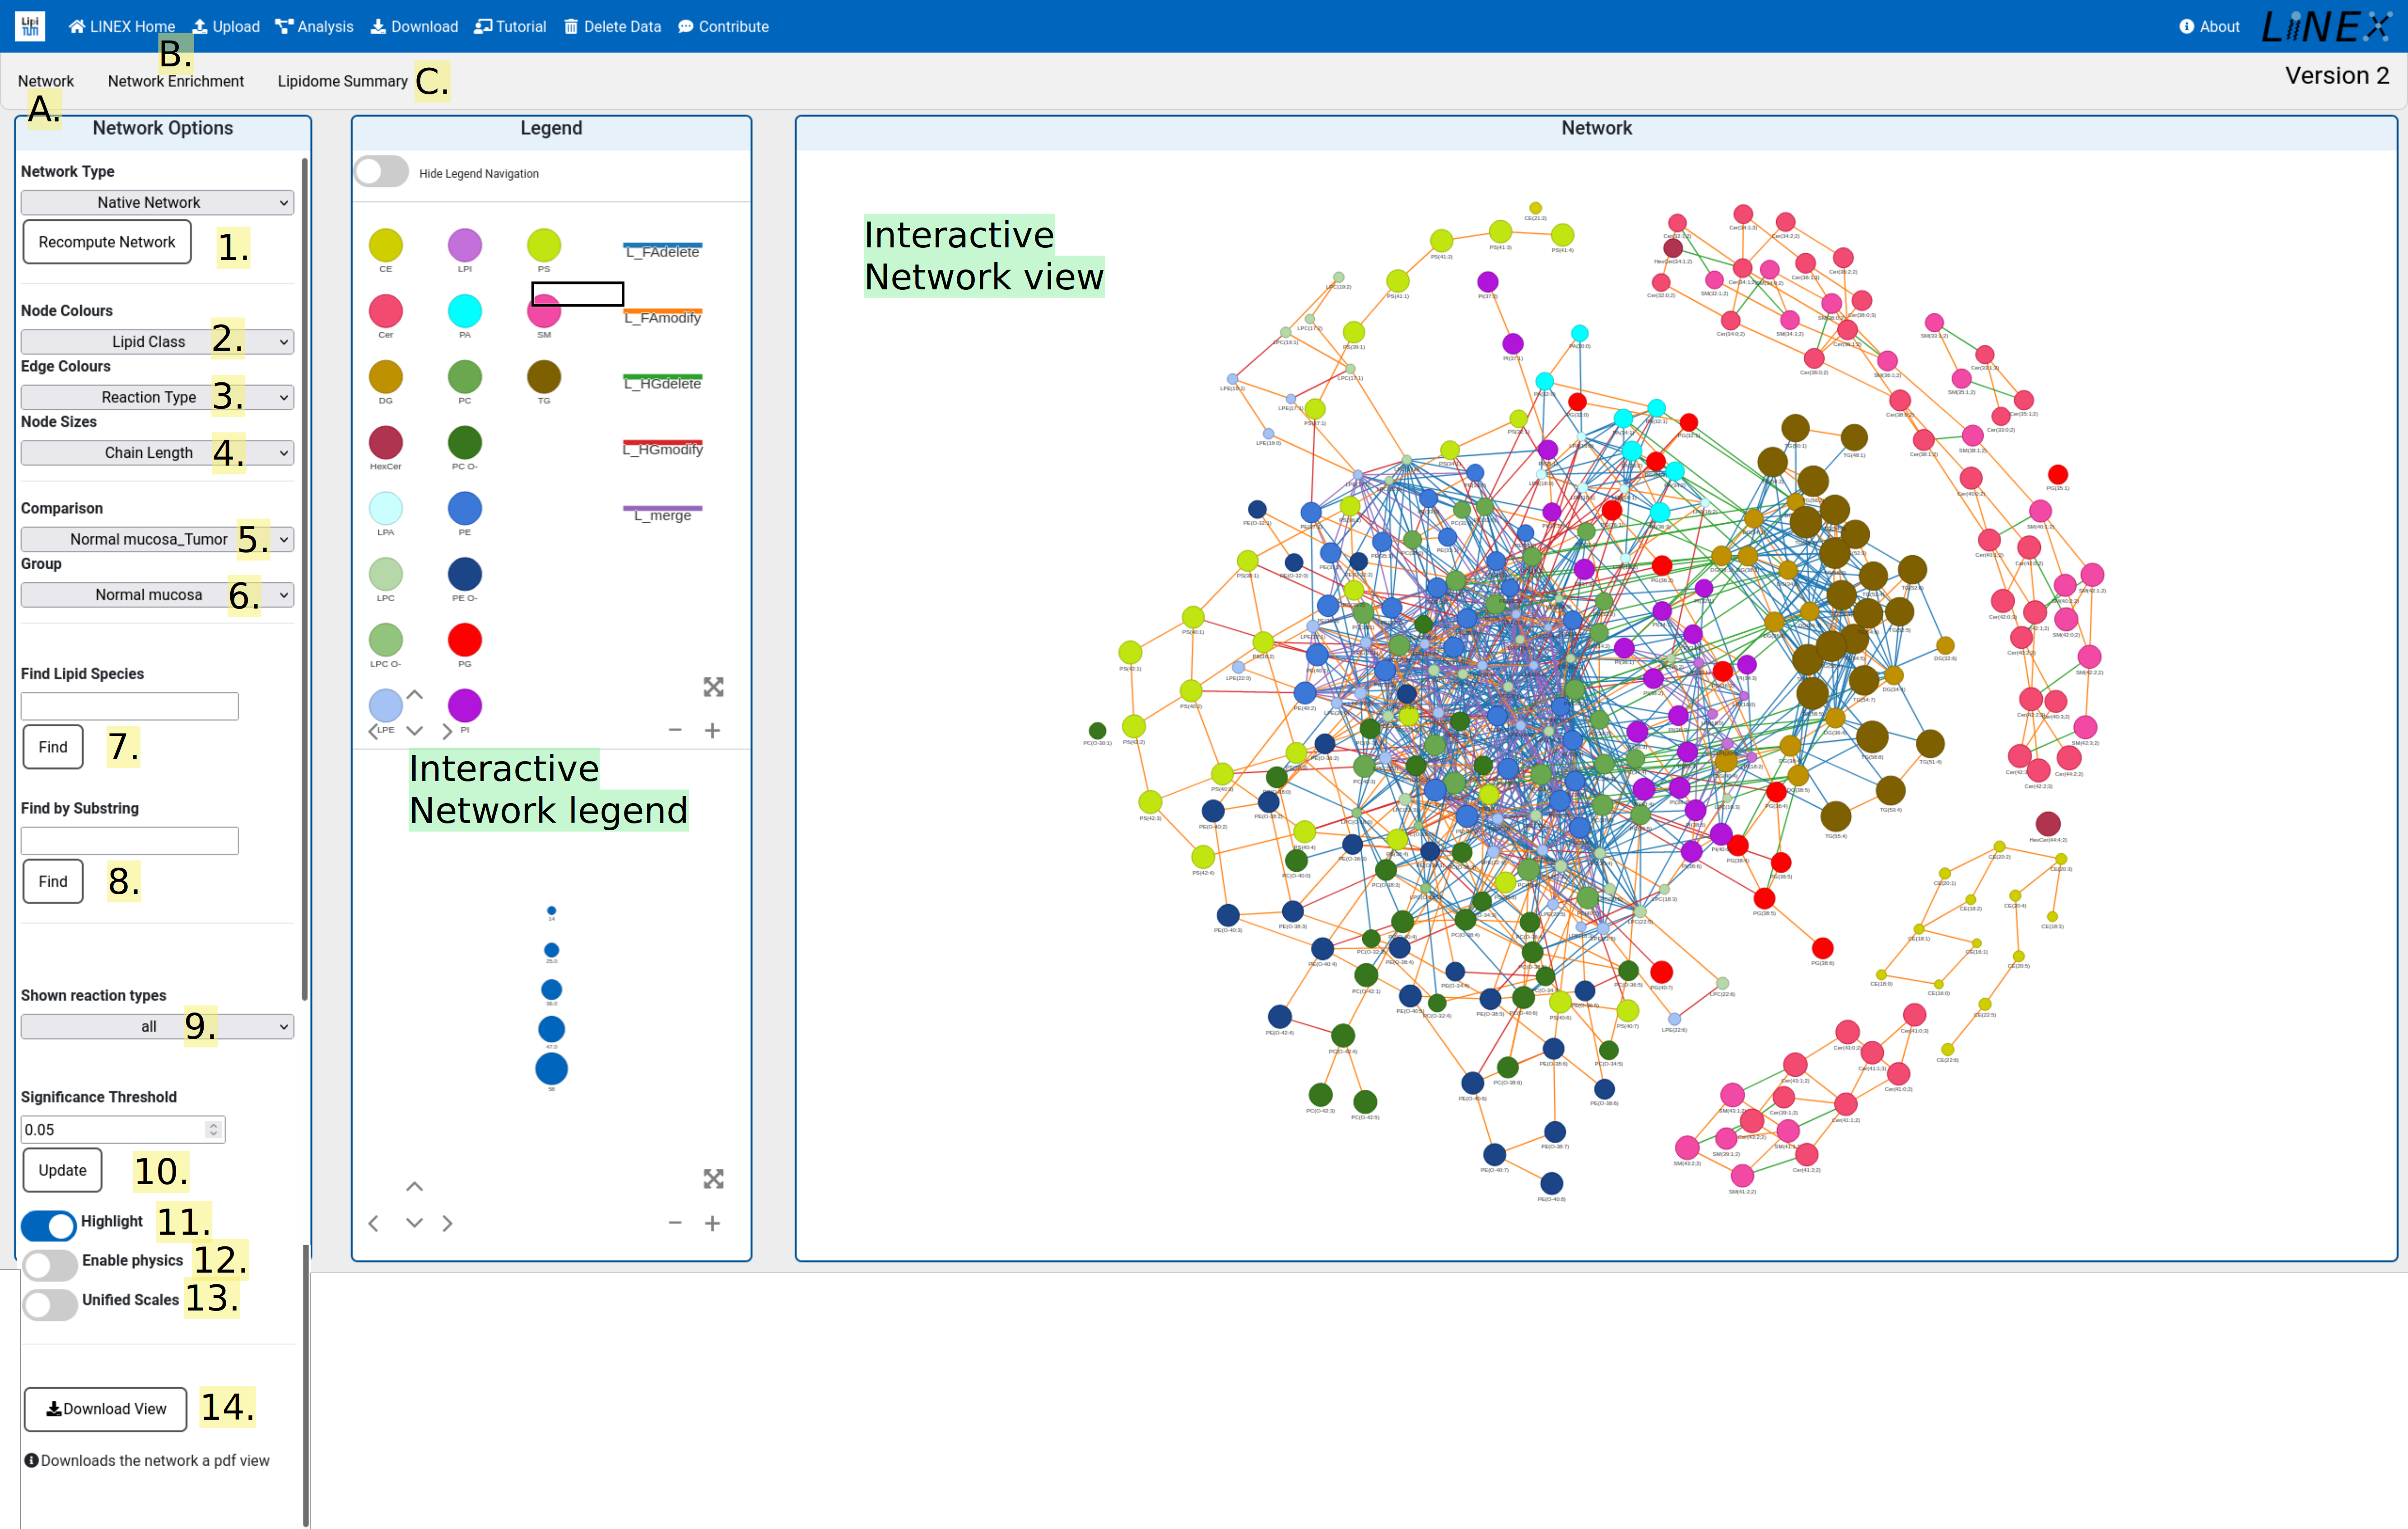
The network view shows the interactive lipid-metabolic network with various visualization parameters:
- Network type
Toggle between network types. The lipid network can be shown with enzymatic reactions as additional nodes and lipids can be shown as potential molecular species if only sum species were uploaded. Switching between network visualizations can take several minutes. Please be patient. - Node colors
Different options to color lipids in the networks. These include lipid class, number of double bonds or fold changes (For this group comparisons can be selected in the field "Comparison"). Fold changes are computed a groupA/groupB (or groupA - groupB if log-transformed/log-ratios). If the selected comparison is groupA_groupB positive (log) fold-changes indicate higher values in groupA. - Edge colors
Coloring of network edges. Examples for options are changes in correlations, reaction type and correlations.
Note:- Only significant correlations are shown
-
Meaning of (partial) correlation changes:
- negative to positive: significant correlation in both groups, <0 in groupA and >0 groupB
- positive to negative: significant correlation in both groups, >0 in groupA and <0 groupB
- significant to insignificant: significant correlation in groupA, insignificant in groupB
- unchanged significant: significant in both groups, either both >0 or both <0
- insignificant: insignificant correlation, i.e. uncorrelated, in both groups
- insignificant to significant: insignificant in groupA, significant in groupB
- Node sizes
Node sizes can be adapted to visualize e.g. fold change, chain length or node degree. - Comparison
For visualizations of statistical properties such as fold change or significance, uploaded sample groups are required. In this field comparisons between groups can be selected. E.g. case vs. control - Group
If values of correlation are visualized one experimental condition has to be selected. This can be done in this selection field. - Find Lipid Species
Find lipids in the network by full name. - Find by substring
Find lipids in the network by substring. You can search e.g. for specific fatty acids. - Shown reaction types.
LINEX2 differentiates between class and fatty acid reactions For detailed information, please consult the paper of LINEX version 2 (Link to publication here: About). Class reactions come from the reaction databases, whereas fatty acid reactions are user defined in the "fatty acid settings" file. It can be toggled which reactions are shown. - Significance threshold
Set a significance threshold for group comparisons. Significant nodes are colored with an additional colored border (See next point). - Highlight
Highlight significant nodes with an additional colored border. - Enable physics
Enable physics in the network. This starts a physics simulation, so the network will adapt to dragging of nodes or when the network type is changed. - Unified scale
Use a unified scale for coloring/sizes when switching between groups and comparisons. - Download view
Download the current network view as pdf. This is preferred for publications, because the network is saved as a vector graphics.
Additional Features
By clicking on nodes or edges in the colour legend all unselected edge/node types will turn grey in the network.
Multiple selection by holding ctrl while selecting is possible. To restore all colours simply click on a non-populated spot inside the colour legend area.
The size legend will be scaled according to the network zoom (i.e. re-scaled every time the network is zoomed in or out).
For better readability it is also possible to zoom the size legend individually.
Zooming via mouse scroll and moving nodes with the cursor is supported for both the network and legend elements.
Additional information can be viewed by hovering over edges and nodes.
The current network view can also be downloaded as a pdf file.
B. Network enrichment view
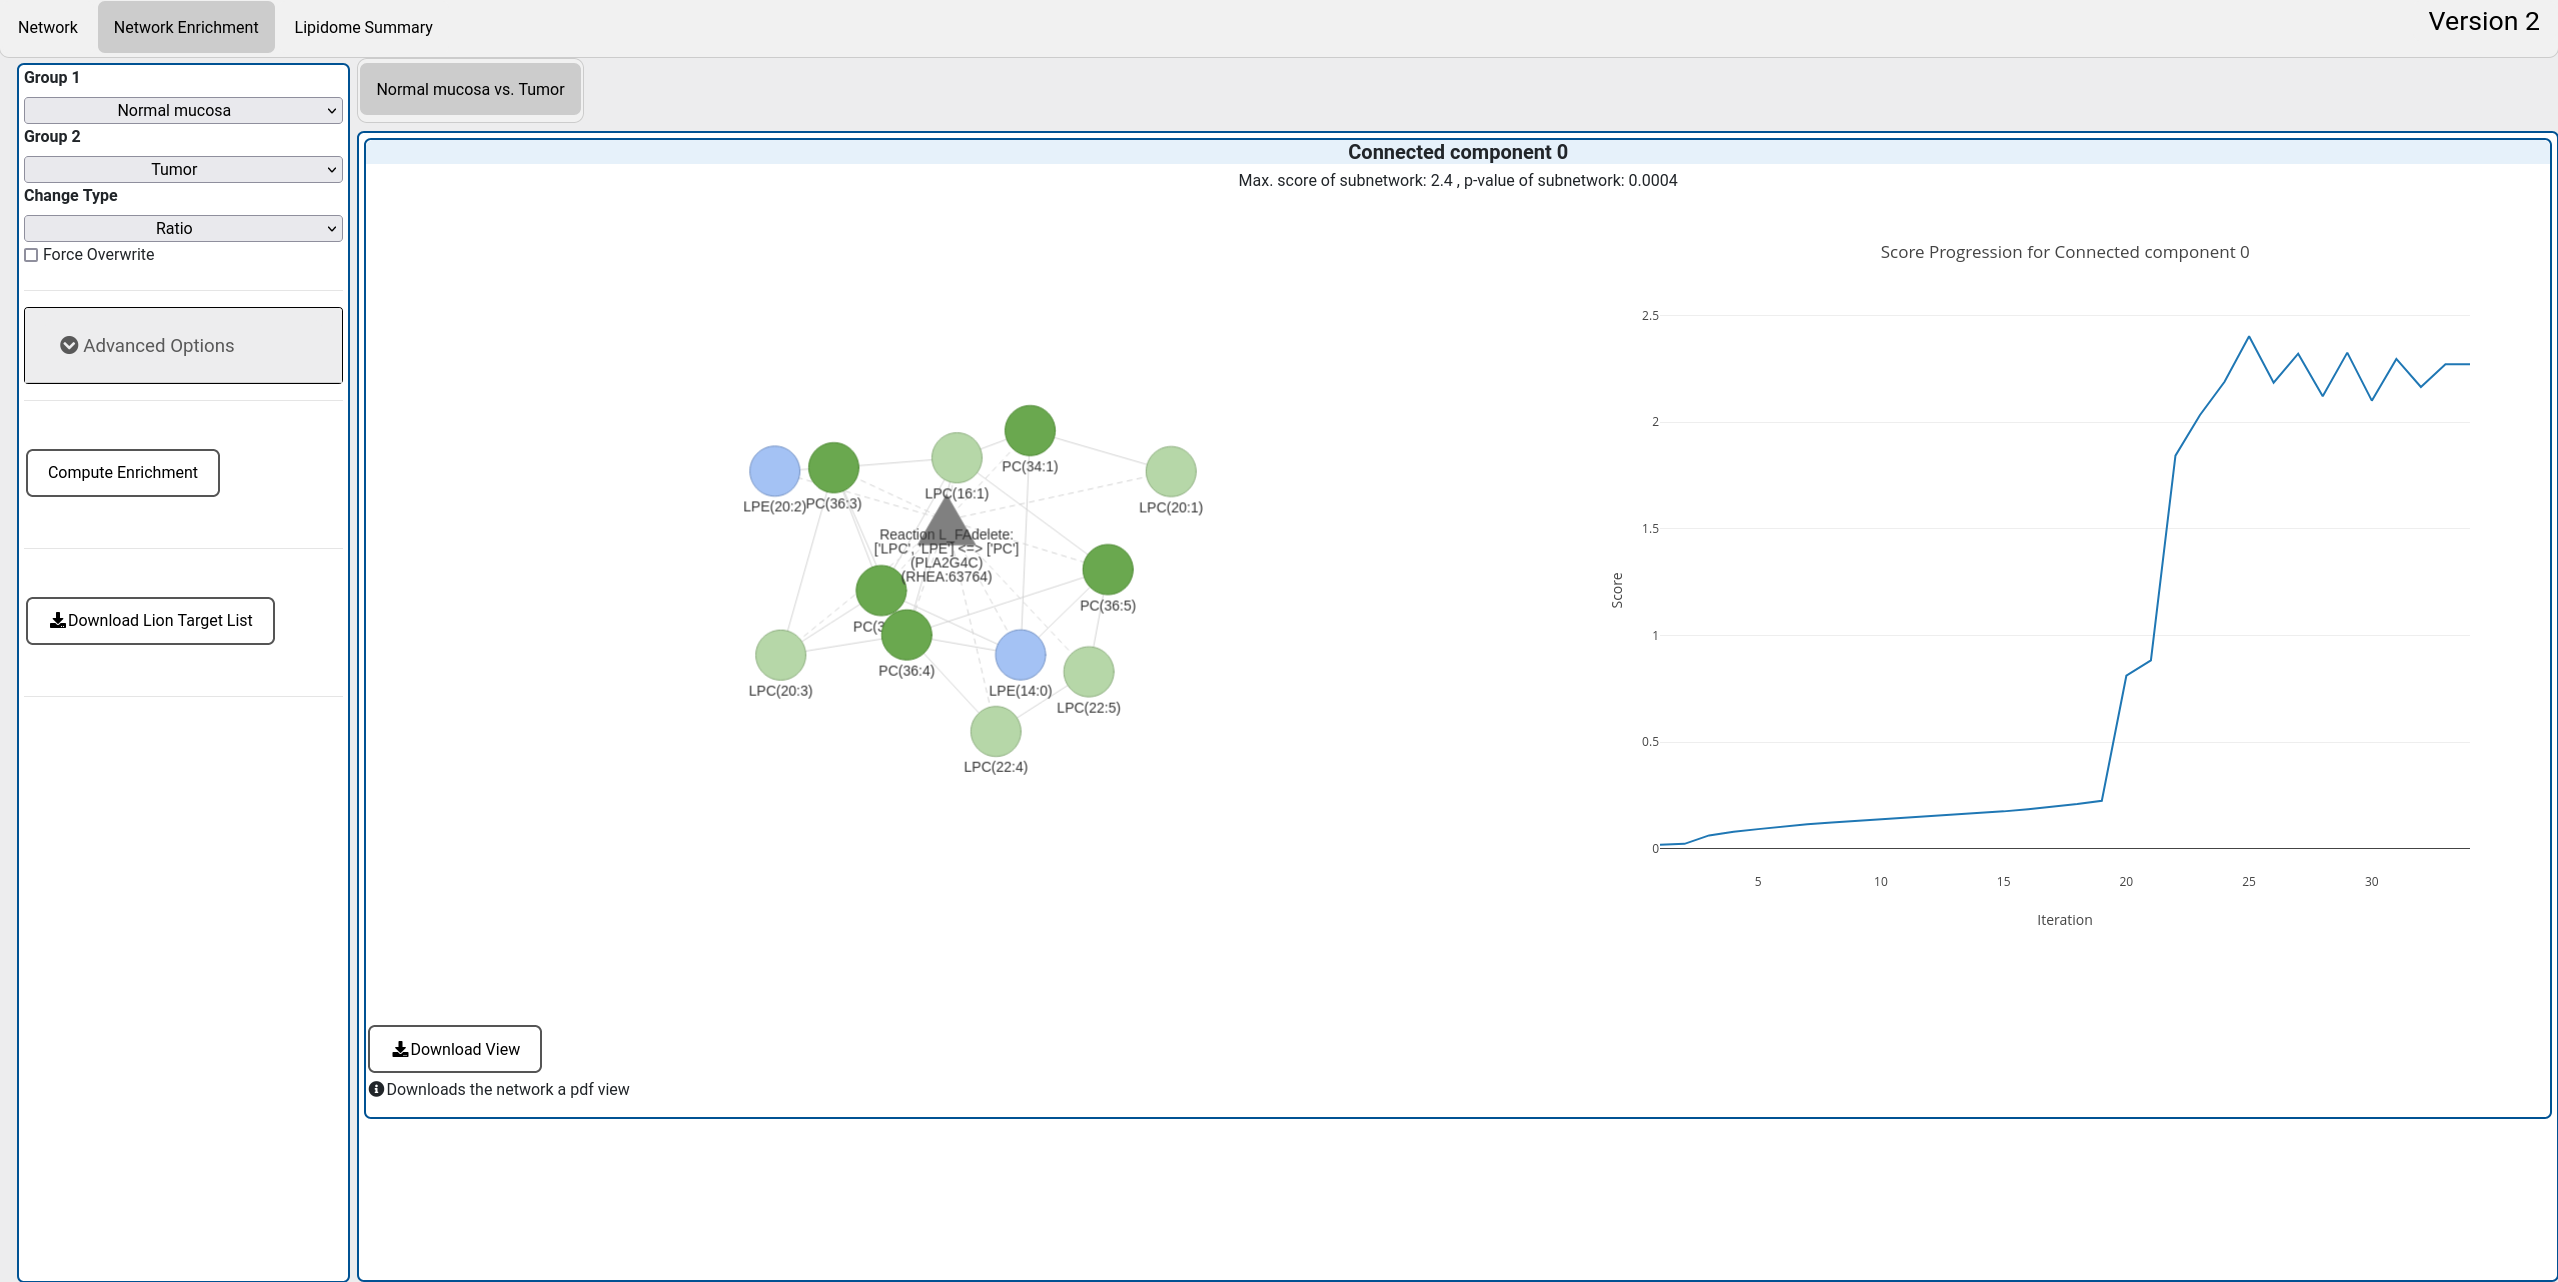
A new feature of LINEX2 is the novel network enrichment algorithm For details, please read the LINEX2 manuscript (Link to publication here: About). The algorithm is meant to generate hypothesis for enzymatic dysregulation from lipidomics data between two experimental conditions. To execute the algorithm, two experimental conditions have to be selected. The enrichment can be based on substrate-product ratios or differences. This will either emphasize relative or absolute differences. The computation is only rerun on the server if parameters are changed. If the enrichment should be repeated for the same scenario with the same parameters "Force overwrite" has to be checked. The results for different comparisons appear in different tabs of the main window. An successful enrichment shows the resulting subnetwork with an empirical p-value and the score development of the algorithm. The network can be downloaded as a pdf file by clicking on "Download view". For the currently shown network a target list for the LION enrichment can be downloaded.
C. Lipidome summary view
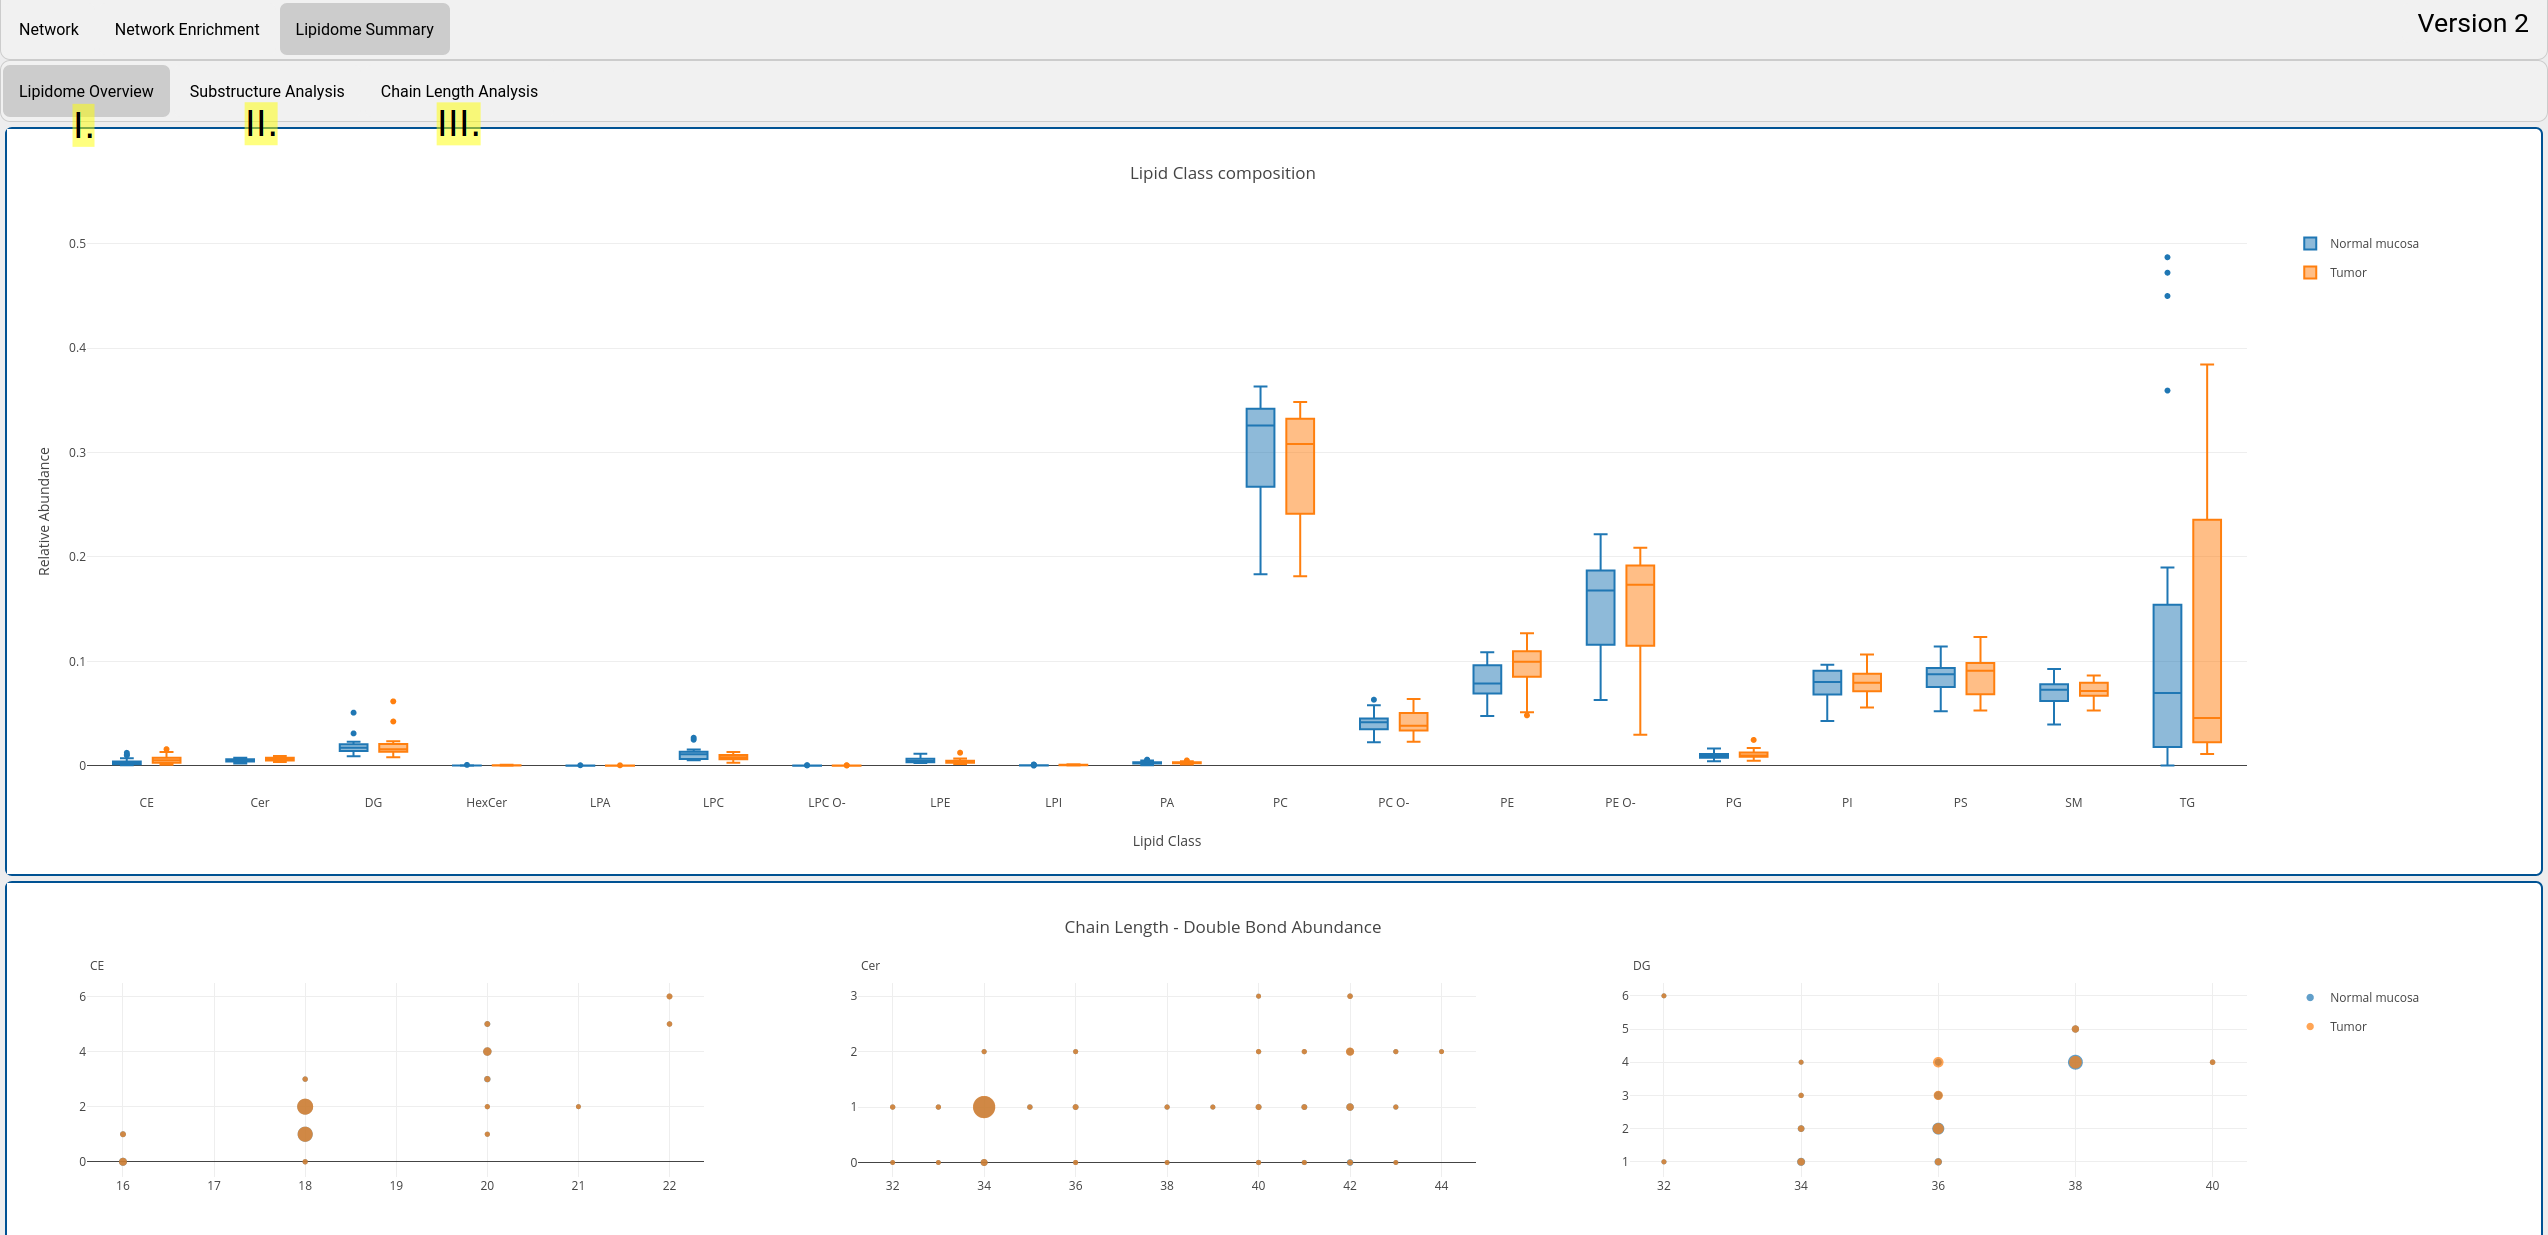
The lipidome summary view provides a general overview of the lipidome. Metabolic reactions as in the network views are not considered. The view consists of three tabs that show visualize different statistical properties:
- Lipidome overview:
Plots of lipidome class composition between experimental conditions, chain length and double bond abundances per lipid class. All plots are interactive. Selections can be done, zoomed, and downloads can be made. - Substructure analysis:
By taking the abundances of combined lipid substructures (also called moieties), changes of the lipidome can reveal connections e.g. between lipid classes and certain chain lengths. This approach is inspired by the work on glycans by Bao et al.. For details, please read the LINEX 2 manuscript (Link to publication here: About). Lipid substructure abundances are visualized as heatmaps and PCA plots. The best substructure features to separate experimental groups can be selected. - Chain length analysis:
Lipid chain length analysis as published by Mohamed et al.. Calculates fold changes for each chain length of a lipid class between two experimental conditions. This can reveal systematic changes of lipid classes towards longer or shorter chains between conditions.
3. Download
Choose the desired files to download
3.1 Network related files
The network can be downloaded as .html file or as .graphml.
The standalone html file can be opened in a browser (locally) and resembles the analysis page with all interactive functions.
Graphml is a general graph storage format. It can be used to import the network into graph tools like Cytoscape in order to generate publication ready plots.
By downloading colour and size legend data the same tools can also be used to create the corresponding legends in a suitable format.
To show the lipid class connections used in your session you can download the corresponding graph as a png image or as a graphml file.
3.2 LipidLynxX related files
LipidLynxX Converted Data along with a list of incorrectly annotated species names can only be downloaded if the conversion options was checked on the upload page.
3.3 Statistical Metrics
All computed statistics (as defined on the upload page) can be downloaded as csv files. If sample groups were given one file for each group (or comparison) will be provided.
For (partial) correlations the full correlation matrix is returned, thus also including values for lipid pairs with no (direct) connection in the network.
3.4 Download pdf-view from JSON
After downloading the standalone html file, the network can be interactively used locally. If high-quality pdf figures of network views should be generated, a JSON file can be generated from the standalone pdf file. These files can be uploaded here and will be converted into a pdf that can be used e.g. in publications.
4. Delete Data
Data is saved on the server for 500 minutes after upload and will automatically be deleted afterwards, but it can be deleted manually here as well.